Fundraiser Statistics
The Tezos Foundation published this article about statistics from its fundraiser in July 2017, shortly after the fundraiser closed. Some of the figures have shifted slightly since then -- for example, more contributors completed the registration process -- but these changes do not alter the basic analysis.
This article presents a short statistical overview of the Tezos fundraiser. The Tezos Foundation will recommend an allocation of XTZ tokens by publishing the network’s genesis block when the network goes live. No XTZ exist until the genesis block has been created. The statistics below refer to the recommended allocation of XTZ that are to be created in the genesis block.
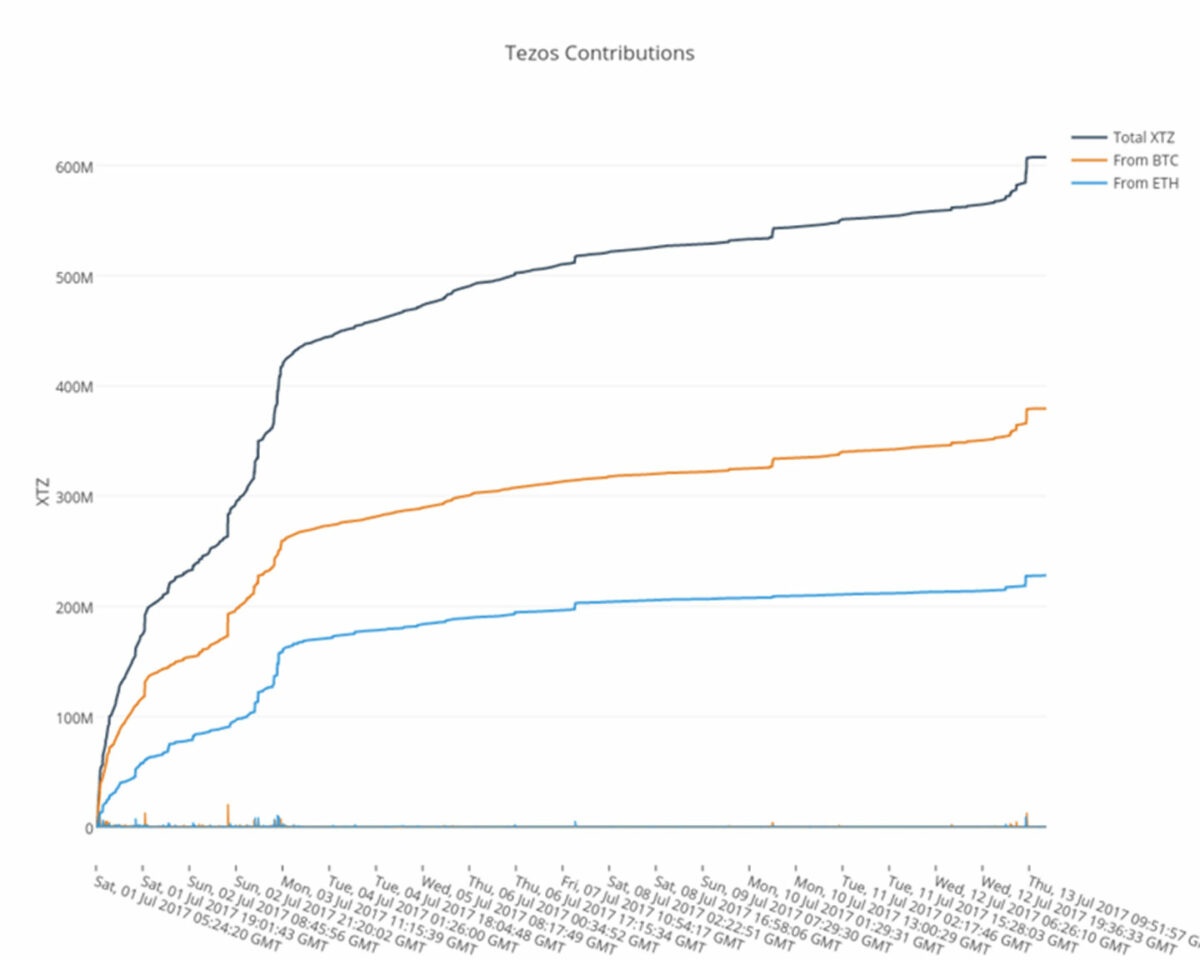
The fundraiser ran from Bitcoin block 473623 to Bitcoin block 475622 (inclusive) and collected 65,681 bitcoins and 361,122 ethers. Most of the contributions happened in the first few days. 62.5% of the contributions were in bitcoin, 37.5% in ether. The following graph recaps the pace of contribution over the fundraiser period.
A bitcoin contribution can only be counted after a contributor has completed the contribution process by registering their key online, as instructed by the PDF. A few participants who contributed within the fundraiser window but had not yet registered their key contacted us, and we were able to include their contribution after their key was registered. However, we will be shutting down registrations before the launch of the genesis block. We have seen extremely few late registrations (less than 0.07%) but these might still increase the exact Bitcoin total. (If you can see your contribution at https://check.tezos.com then you have successfully registered your key.)
Given the current numbers, a total of 607,489,040.89 ꜩ will be created in the genesis block for fundraiser participants, a further 3,156,502.85 ꜩ will be created for early backers and contractors, and 76,330,692.97 ꜩ each will be created for the Tezos Foundation and DLS. The allocations to the Tezos Foundation and DLS will vest monthly over 4 years. This implies a total initial supply of 763,306,929.69 ꜩ tokens with 20% locked in vesting contracts.
30,317 wallets were funded. The average contribution will yield a recommended allocation of 20,035 ꜩ. The median contribution is smaller at 2,331 ꜩ. Given the power law distribution of the data, a more meaningful number is the geometric average: 2,908 ꜩ.
The Gini coefficient is a measure of statistical dispersion ranging from 0 to 1. A coefficient of 0 would indicate an equal allocation to every wallet, while a coefficient of 1 would describe a dataset where the entire allocation goes to a single contributor. The Gini coefficient of contributions is 0.878, which is slightly higher than the Gini coefficient of the Ethereum crowdsale (0.832), or wealth in the world (0.804), the United States (0.801), and Switzerland (0.803).
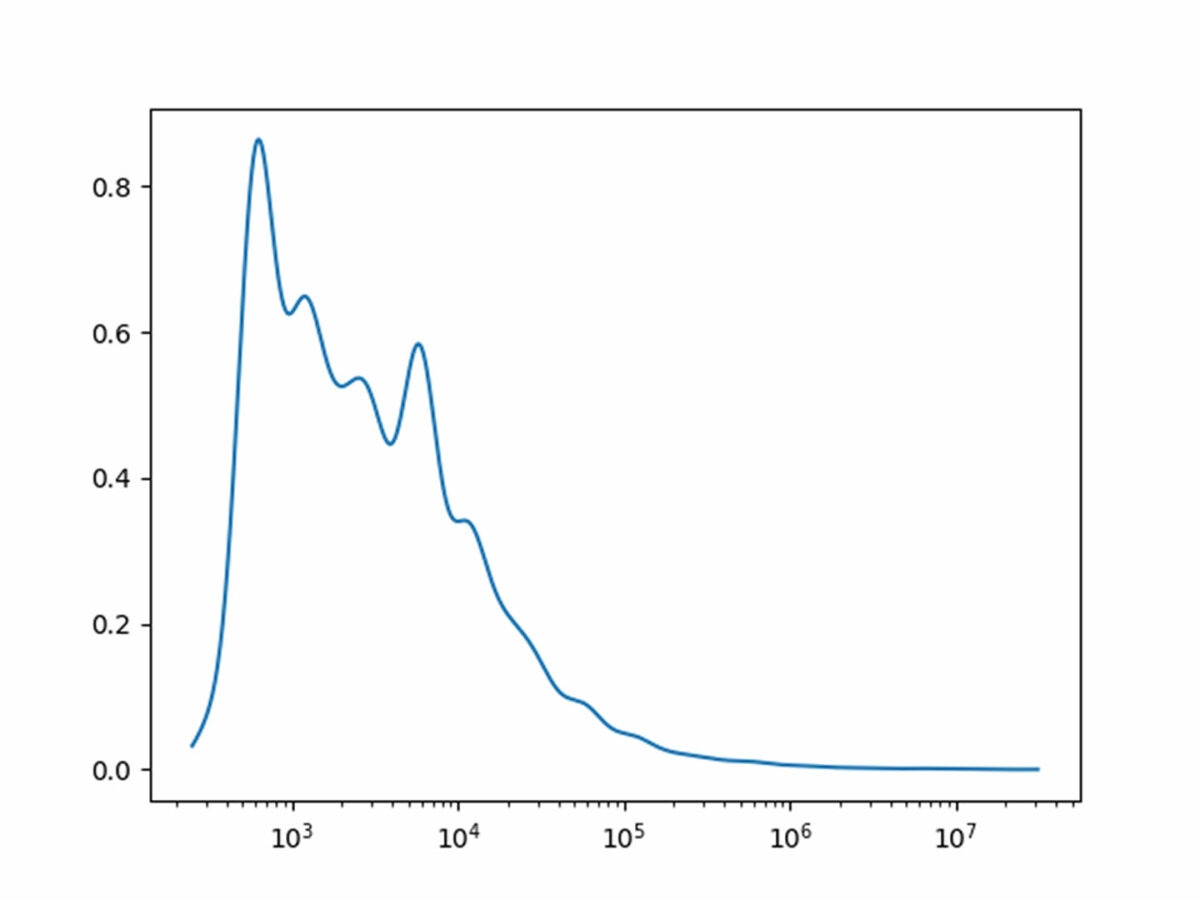
For the statistically inclined, here’s a rough density plot of contributions on a log scale. A pure Pareto distribution is a shifted exponential distribution on a log scale. This seems to have a fatter mode and a thinner tail, indicating that the distribution is more even among smaller contributions.
Everything is linear if plotted log-log with a fat magic marker (Mar’s law). A linear regression of log contribution over log rank suggests a Pareto index of 1.431, though the slope is lower for large contributions and higher for smaller ones. However, Hill’s estimator gives a Pareto index of 0.408 which shows that trying to quantitatively measure small tail exponents with “only” 30,000 data points is somewhat futile.
Here are some percentiles of contributions. The fifth percentile (5%) indicates the smallest contribution in the top 5% of contributions.
| Percentile | XTZ |
|---|---|
| 5% | 44,003 |
| 10% | 20,414 |
| 25% | 6,413 |
| 50% | 2,332 |
| 75% | 859 |
| 90% | 593 |
| 95% | 528 |